|
TCS is a high performance, extremely flexible system for monitoring trends in
time-series data. TCS was expressly developed to help Remote Controls operators and
managers to visualize and understand the state of their plants, but it can be used for
every other kind of activity where there are time-series data to display and to archive as
for example the financial analysis.
TCS has two components, a collector and a grapher. The collector runs at
configurable time interval, and stores data into a datastructure. Later, when you want to
check on the data you have collected, you can use a the graphics interface to view graphs
of the data.
Furthermore with the spreading of monitoring systems, like SCADA systems, often the
need raise to control data coming from many acquisition systems and memorized on different
data bases, sometimes residing on different machines in one or more networks. The program
TCS was developed to show the trends of these data using a single program.
The data can be external data, collected from one or more acquisition systems of a net
and/or internal performance data of servers. In
a general way the program can manage every kind of values, stored and periodically
updated, in a Data Base which can be reached form the computer where the program runs, via
SQL queries through the opportune drivers (ODBC and/or BDE) .
It can be useful to follow the trends of data mainly over a long period of time and to
store important data for successive review. It can be useful also to follow the relevant
parameters of a server to control and optimize the performances in peak activities
periods, as can be a sustained alarms period in a supervision system. The data can
be displayed, stored, printed and exported either in graphical form either in numerical
form. The program includes spreadsheet functions.
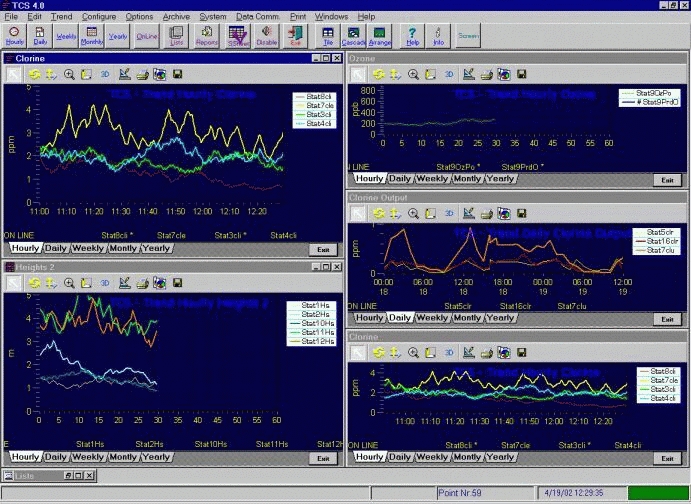
It allows to visualize, in one single page or in multiple pages, different trends graphics. Every
graphic can display a maximum of 6 curves. The maximum number of points data the program
can manage is 10,000. The trends can be visualized on hourly, daily, weekly, monthly and
yearly basis. The graphics display the points values, as they are coming from the field
for the hourly trends, while the other graphics report, on selection, the arithmetic
average or the weighted average (hourly average for daily and weekly trends and daily
average for monthly and yearly trends). The weighted average is based on the time interval
between an upgrade and the next .
The data can be only visualized or also memorized in a historical archive.
It is possible to configure the system in such a way that if a parameter is in
alarm state (the state is acquired from the data base, together with the point value), the
graphics containing it will be visualized automatically, in the case it were not already
displayed. The data are allowable also in spreadsheet form, for eventual calculations.
The data acquisition is taken by means of SQL queries,
from one or more data bases. It is possible to configure just to 10 different queries,
each with one associated timer which allows to set independently the acquisition time for
the cyclical interrogation. As alternative or in addition the data can be acquired through
a data file.

Single Graph display
(click on the pic to see the enlarged version)
The Internal Data function, which works on Windows NT/2000/XP systems,
have been introduced to follow the system performances. It works as Performance Monitor
taking the system data. Its Configuration panel appears and works like the one of the
windows program Performance Monitor. It can be used to monitor the system load during peak
alarm state conditions, when a lot of signals change it state to alarm or other critical
situations. It can be used also to optimize system configuration.
The Internal Data are taken from Performance Monitor and all the
parameters available in the Performance Monitor can be followed in the time.
A dedicated timer allow to configure the time interval at which the
configured data have to be updated.
TCS 4.20 is largely configurable either as presentation either as
functionality.
A simulation mode is present in which data are generated internally by the program
producing random values between the configured maximum and minimum values of the points.
Multiple Graphs Display
(click on the pic to see the enlarged version)
TCS 4.20 use for the graphic display the TeeChart Pro v5.02, written by
David Berneda and distributed by Steema SL. of Barcelona, Catalonia, Spain.
www: http://www.steema.com
Queries Configuration
Internal Data Configuration
Distribution
The program is distributed as trialware. You can try it for free for a 30
days period. You can get it from the Download
page and to register the program from the Registration
page from which different order forms are selectable to place an order.
Press here if you like
to see the list of Shareware Sites where TCS 4.20 is published |